Gait Analysis
For this project, we were supposed to track someone as they were walking, and find their gait frequency. We did this using an accelerometer app, and we taped it to the back of all of our subjects. We found our frequency in steps per 16 seconds, because we asked all of our subjects to take 16 steps each. We were supposed to use this data to determine their gait, and compare it to others. This would solve purpose of what is a gait? How can it be used to identify others? The last question we had to answer was how you could predict gait, which we figured out through our end product.
We used several subjects' data from walking and put all of the information in a graph so we could see everything. (below)
We used several subjects' data from walking and put all of the information in a graph so we could see everything. (below)
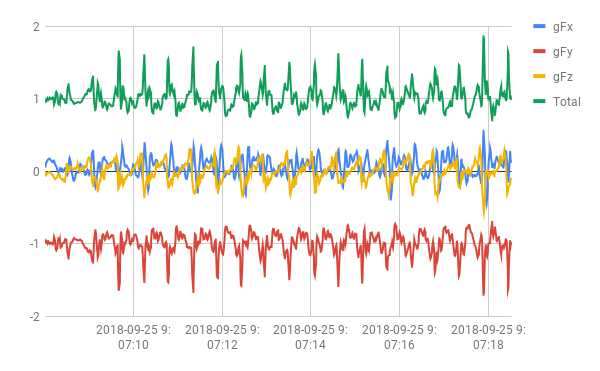
Graph of Eliza |
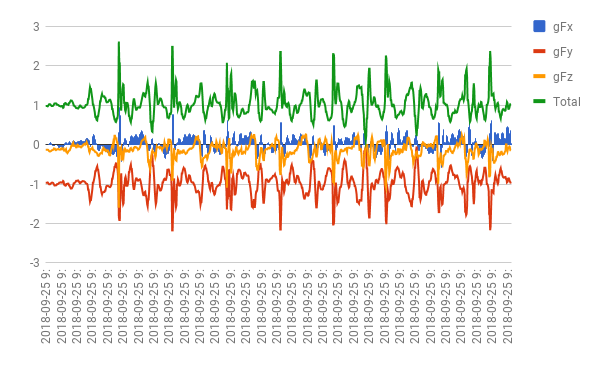
Graph of Emma |
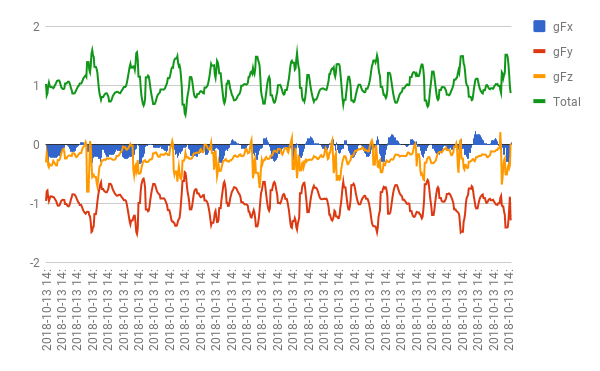
Graph of Jake |
These graphs were then put into a graph of the average frequency vs steps, which we found a line of best fit of to get our equation to predict gait: y=-0.122x+6.445
Where x = leg length
and y = frequency
After finding that, we would be able to either plug in someone's height, or gait frequency (if they happen to know their pace in steps per 16 seconds) and predict!
Where x = leg length
and y = frequency
After finding that, we would be able to either plug in someone's height, or gait frequency (if they happen to know their pace in steps per 16 seconds) and predict!
Our Full Report: |
A Micro Presentation: |
Terms
Accelerometer: an instrument for measuring acceleration, typically that of an automobile, ship, aircraft, or spacecraftGait: a person's manner of walking
Dynamicity: In terms of gait analysis, the quantification of variations in kinematic or kinetic parameters within a step
Frequency: number of occurrences of a repeating event per unit of time
Functions: a relationship or expression involving one or more variables
Leg Length: a measurement from the bottom on heel to top of hip bone
Line of Best Fit: is a straight line that best represents the data on a scatter plot
Metric: A quantitative indicator of a characteristic or attribute
Model: In technology, a description of observed or predicted behavior of some system, simplified by ignoring certain details.
Physical Characteristics: defining traits or features about your body
Regressions: a measure of the relation between the mean value of one variable and corresponding values of other variables
Report: give a spoken or written account of something that one has observed
Symmetry: In terms of gait analysis, the quantification of differences between left-foot and right-foot steps
Variability: In terms of gait analysis, the quantification of fluctuations from one stride to the next
Wavelength: the distance between successive crests of a wave
Reflection
This project was actually very difficult for me, and throughout I had two major peaks and two major pits.
At first, it was very hard to work on this project, because I had missed one of the days in class when we had supervised time to work on it, so I felt behind. This gave me extra work to catch up, and my group members were understanding about teaching me and filling me in. My second pit was google sheets. I found it extremely confusing, but luckily with division of roles, I was able to observe my group mates that were good at that aspect, while I did a part that I was much more comfortable in.
Some good things about our group was that we worked really good together. We are all good friends, so we could meet after school and call each other when we had questions. Another really good thing for us in this project was our flexibility. Not only were we willing to try new things or jump into something new, but when it came time we all were able to review each others work and accept constructive criticism, which was really important in making our project the best that it could be.
